
The Internet worms from 10 years ago (e.g., Code Red, Slammer, Witty) propagated by copying themselves to remote hosts without any user intervention. Today, however, few malware families have the ability to propagate autonomously. Instead, they rely on malware delivery networks, which specialize in helping malware infect millions of hosts worldwide. These malware delivery networks can use a variety of methods to gain entry to the victim hosts, such as vulnerability exploits, social engineering, ad-supported software or third party bundles. Once they have gained entry, they install downloader trojans, which deliver additional, and often unrelated, malware samples on those hosts.
Downloader trojans (also known as droppers) perform a simple function: they retrieve additional executable binaries (known as payloads) from the Internet, sometimes in response to remote commands. The payloads typically perform the really malicious actions, such as stealing information, encrypting files (to hold them for ransom), sending spam, etc. Some of the payloads also have dropper functionality (e.g., in the case of self-updating botnets) and download more malware. Many benign applications also include downloaders, which deliver installers and software updates. In consequence, it is difficult to distinguish between benign and malicious downloaders based on their content and behavior. This gives droppers a window of opportunity to operate undetected by anti-virus and intrusion protection systems. In our research [CCS 2015] we used the WINE platform to estimate that 54% of malicious downloaders appear in the wild before any anti-virus product used by Virus Total can detect them—that is, 80.6 days (approximately 2.7 months) earlier, on average.
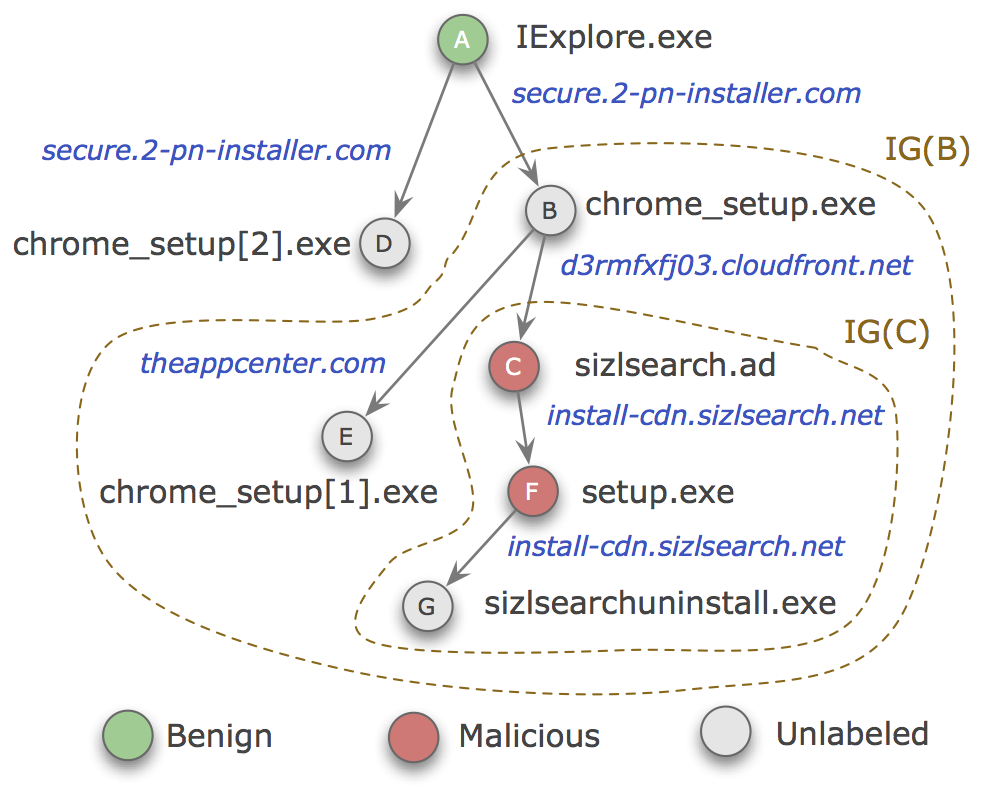
If we can determine the downloader-payload relationship among the executable files found on a host, we can reconstruct the downloader graph generated by this relationship. Our research has also shown that these downloader graphs can provide unique insights into malware distribution. The figure on the right shows a real-world example of a downloader graph. In this case, a benign Web browser (node A) downloaded two files from the same domain: nodes B and D. These files are unlabeled (i.e., not known to be malicious or benign). However, node B downloaded additional files, some of which (nodes C and F) are known to be malicious, suggesting that node B, as well as all the nodes reachable from node B in the downloader graph, are likely involved in malware distribution. If we could identify malicious downloader graphs, we would be able to expose large parts of the malware download activity, which may otherwise remain undetected. It turns out that we can do this because benign and malicious downloader graphs have different properties.
Using telemetry from Symantec’s anti-virus and intrusion-protection products, made available to researchers through the WINE platform, we reconstructed 19 million downloader graphs, reflecting the download activity on 5 million Windows hosts around the world. We found that, when the graph diameter (the maximum length of the shortest path between two nodes) is 3 and above, 84% of graphs correspond to malware download activity. Similarly, almost 88% of the graphs that grow slowly (average inter-download time > 1.5 days/node) represent malicious downloads. Surprisingly, we also found that 55.5% of malicious downloaders are digitally signed, and 22.4% have valid X.509 certificates. This practice likely stems from a desire to evade detection, as benign software is usually signed; for example, Stuxnet was not detected by anti-virus programs because it was signed with a legitimate, but compromised, certificate.
Building on these insights, we implemented a system for downloader graph analytics.
We trained a machine learning classifier, using 16 features extracted from the downloader graphs, to detect the sub-graphs that likely correspond to malware distribution (e.g., IG(B) and IG(C) in the example).
When designing such a system, we must consider the fact that different types of malware may produce downloader graphs with different properties; from the point of view of a classifier trying to label each graph as benign or malicious, this means that the training data has high variability or many outliers.
Given these constraints, we used a random forest classifier, which is robust to outliers and can scale to large volumes of data.
Intuitively, a random forest consists of a set of decision trees, where each tree is trained using only a subset of features (randomly chosen); we can expect that different decision trees will specialize on different subclasses of malicious and benign programs and will champion their cause in the final classification.
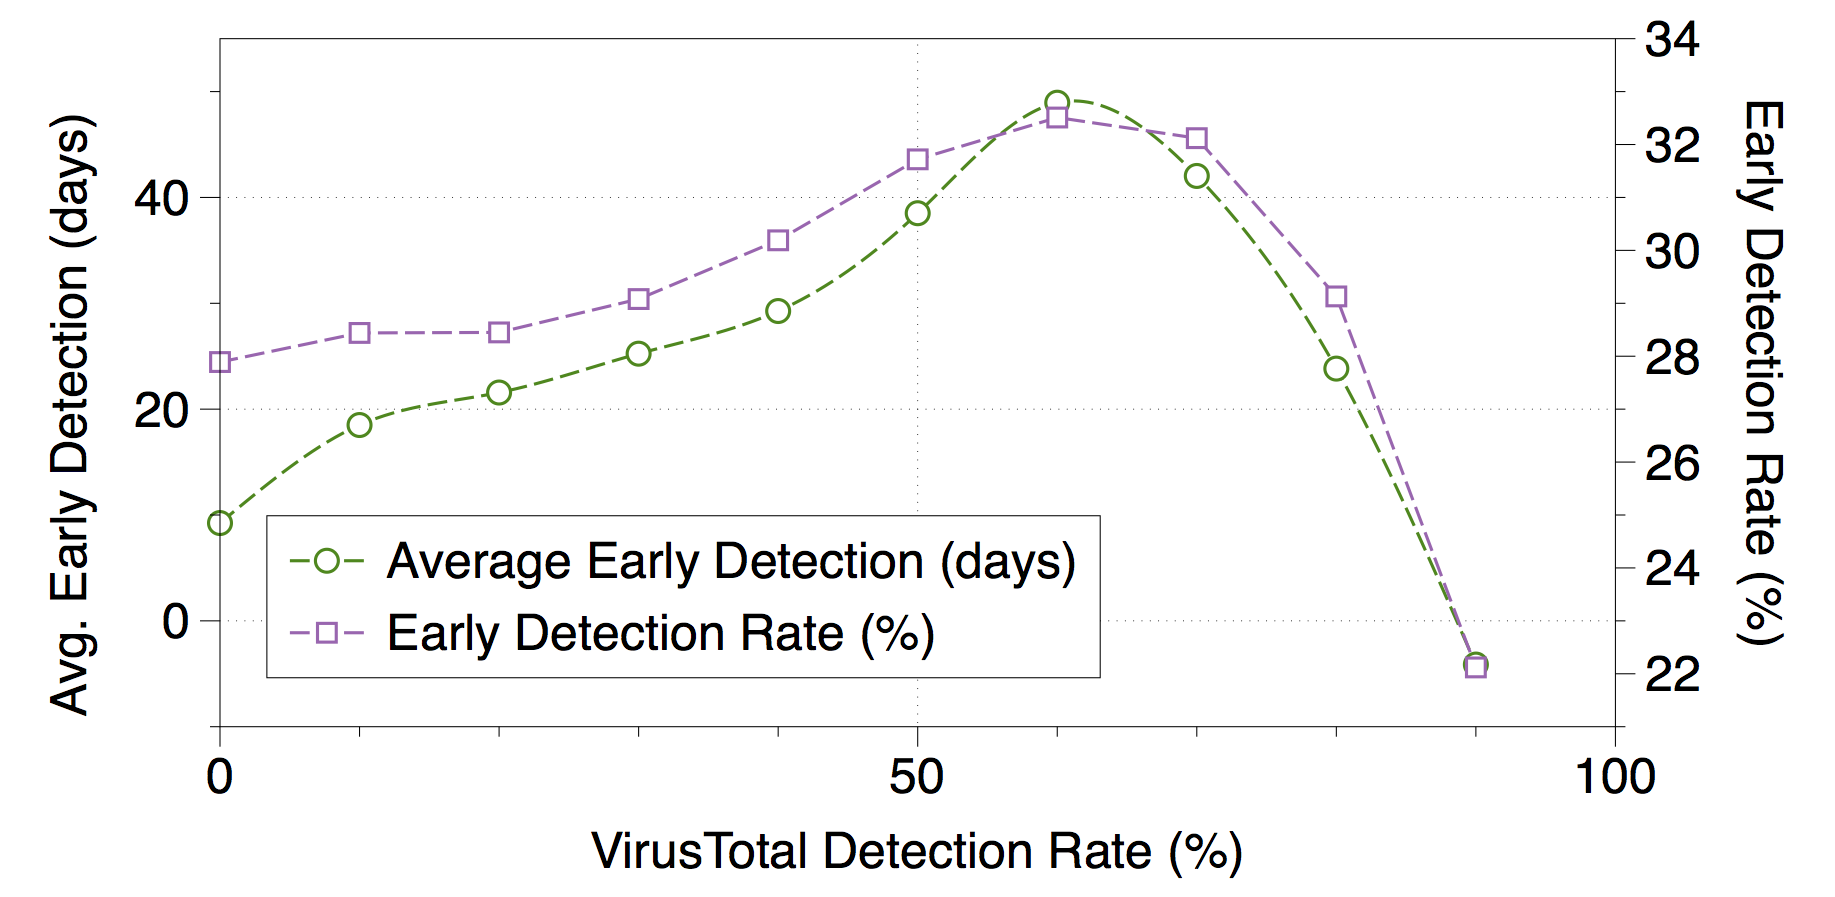
Our system achieves a 96.0% true-positive rate, with a 1.0% false-positive rate. The area under the ROC curve is 0.998. Moreover, our system detects malware about 9 days, on average, before the first detection recorded by Virus Total. Interestingly, the more anti-virus products in Virus Total agree that a sample is malicious, the earlier we are able to detect it (up to a point where 60% of the products are in agreement). The figure on the left illustrates this result. For files considered malicious by 60% of the engines invoked by Virus Total, our detection lead time is nearly 50 days. The full details of our system’s design and evaluation are in the paper [CCS 2015].
These results illustrate the opportunity for incorporating downloader graph analytics in malware detection systems. They also have important implications for attack attribution: the proportion of malware downloaders that have digital signatures suggests that the organizations responsible for a large part of the malware download activity identify themselves voluntarily by signing their droppers.
Paper: [CCS 2015] [Explore the data]
References
[CCS 2015] B. J. Kwon, J. Mondal, J. Jang, L. Bilge, and T. Dumitraș, “The Dropper Effect: Insights into Malware Distribution with Downloader Graph Analytics,” in ACM Conference on Computer and Communications Security (CCS), Denver, CO, 2015, pp. 1118–1129.
PDF